Identify Slow Queries
A first step is to identify, to know which queries are running slow on the framework databases.
Queries For Identification
Microsoft provides a couple of queries to find out which queries are slow (source).
Note
Read the paragraph Errors Running Queries below if the queries return error messages, on how to fix the issue.
Current High-CPU Activity
The first identifies all queries with high-CPU activity which are currently running:
SELECT TOP 10 s.session_id,
           r.status,
           r.cpu_time,
           r.logical_reads,
           r.reads,
           r.writes,
           r.total_elapsed_time / (1000 * 60) 'Elaps M',
           SUBSTRING(st.TEXT, (r.statement_start_offset / 2) + 1,
           ((CASE r.statement_end_offset
                WHEN -1 THEN DATALENGTH(st.TEXT)
                ELSE r.statement_end_offset
            END - r.statement_start_offset) / 2) + 1) AS statement_text,
           COALESCE(QUOTENAME(DB_NAME(st.dbid)) + N'.' + QUOTENAME(OBJECT_SCHEMA_NAME(st.objectid, st.dbid))
           + N'.' + QUOTENAME(OBJECT_NAME(st.objectid, st.dbid)), '') AS command_text,
           r.command,
           s.login_name,
           s.host_name,
           s.program_name,
           s.last_request_end_time,
           s.login_time,
           r.open_transaction_count
FROM sys.dm_exec_sessions AS s
JOIN sys.dm_exec_requests AS r ON r.session_id = s.session_id CROSS APPLY sys.Dm_exec_sql_text(r.sql_handle) AS st
WHERE r.session_id != @@SPID
ORDER BY r.cpu_time DESC;
Example return set:

Historical High-CPU Activity
If the queries have been executed already, it is possible to look up for historical CPU-bound queries:
SELECT TOP 10 st.text AS batch_text,
    SUBSTRING(st.TEXT, (qs.statement_start_offset / 2) + 1, ((CASE qs.statement_end_offset WHEN - 1 THEN DATALENGTH(st.TEXT) ELSE qs.statement_end_offset END - qs.statement_start_offset) / 2) + 1) AS statement_text,
    (qs.total_worker_time / 1000) / qs.execution_count AS avg_cpu_time_ms,
    (qs.total_elapsed_time / 1000) / qs.execution_count AS avg_elapsed_time_ms,
    qs.total_logical_reads / qs.execution_count AS avg_logical_reads,
    (qs.total_worker_time / 1000) AS cumulative_cpu_time_all_executions_ms,
    (qs.total_elapsed_time / 1000) AS cumulative_elapsed_time_all_executions_ms
FROM sys.dm_exec_query_stats qs
CROSS APPLY sys.dm_exec_sql_text(sql_handle) st
ORDER BY(qs.total_worker_time / qs.execution_count) DESC;
Example return set:

Next Steps
After knowing which queries are slow and thereby also which indexes are involved, the next step would be Reorganise Indexes.
Killing User Sessions
However, if a query is still being executed in an active session but the job on the front-end (e.g. the framework) is already stopped, it might be necessary to kill the user session instead.
Take the session_id from the Current High-CPU Activity query output, replace the number with the <session_id> placeholders below and execute them to stop the query and remove the user session from the database.
-- Kill the user session.
KILL <session_id>;

-- Returns a progress report.
KILL <session_id> WITH STATUSONLY;
Example:
-- Kills session with session id 55.
KILL 55;

-- Returns a progress report on the kill action of session with id 55.
KILL 55 WITH STATUSONLY;
For more information on the KILL statement, please consult the Microsoft documentation: KILL
Errors Running Queries
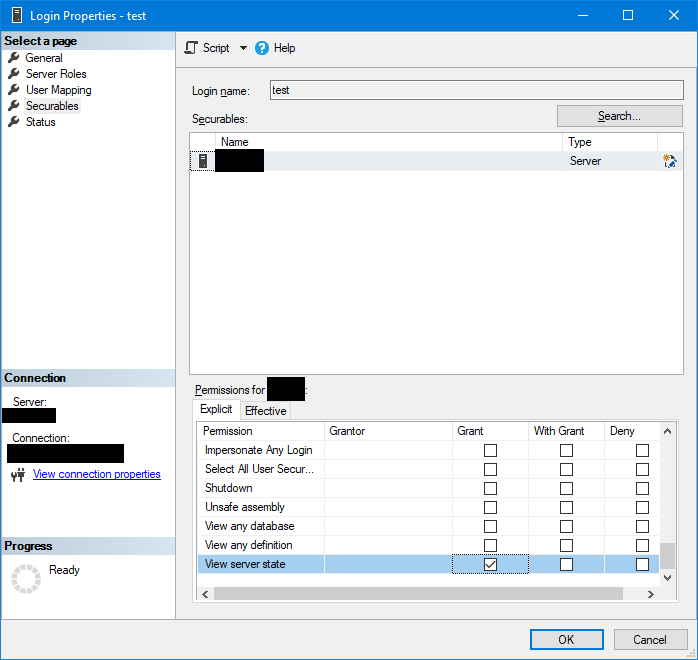
When running one of those queries above returns error messages, it might be that the user account doesn't have enough access rights to system tables.
Open the properties dialog of the user account and make sure that the View server state permissions are granted:
