Subscriptions
Subscriptions manage the monitoring of OPC UA devices and handle how data changes should be handled within the Ometa Framework.
Tip
The frequency of data changes from devices is configured by the deadband type and value.
Performance Considerations
The most important option regarding performance is the handler type. It defines how data changes should be handled. The following options are available:
- Method call: Executes a method within the framework.
- Direct write to case: Writes the variable to the case database without consulting the case management engine.
While method calls allow for more flexible customization, they come at a significant performance cost for sensors with rapid fluctuating data. We recommend to use the Direct write to case option for the devices which data just needs to be logged and using the Method call for key devices which define a workflow or customization.
Creating a New Subscription
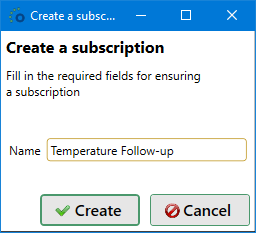
To add a new subscription, click Create in the ribbon. A dialog pops up, type in the name and click on the Create button.
At this point a new unsaved subscription is created. Some configurations must still be made:
- Handler type: Method call or Direct write to case, refer to Performance Considerations for more information. Keep in mind that when a type is selected and the subscription is saved, it cannot be modified again.
- Monitoring variable: The name of the fields within the OPC UA device to monitor. The first monitoring variable found on the device, will be monitored.
The tab Result Handling contains the mapping to fields or lifecycle properties, depending on the handler type:
- Method configuration: An object, profile, method and possible data extension profiles are required.
- Lifecycle: A lifecycle must be selected.
Consult the paragraphs below for a method or a lifecycle for more information.
When saving the new subscription, the Ometa OPC UA Service internally reloads the available subscriptions.
Warning
Reloading the available subscriptions means that the monitoring of all items will be stopped and restarted with the updated configuration. This reloading will happen at every Save action.
Note
There is no need to re-send sensor information to the service for monitoring after a reload. The service keeps all information within the Ometa Framework database and this way all configuration and sensors for monitoring are immediately available after a reload or service restart.
Result Handling for a Method
This tab contains the configuration for the method call, allowing parameters from the OPC UA device variable to be passed on as input to the method.
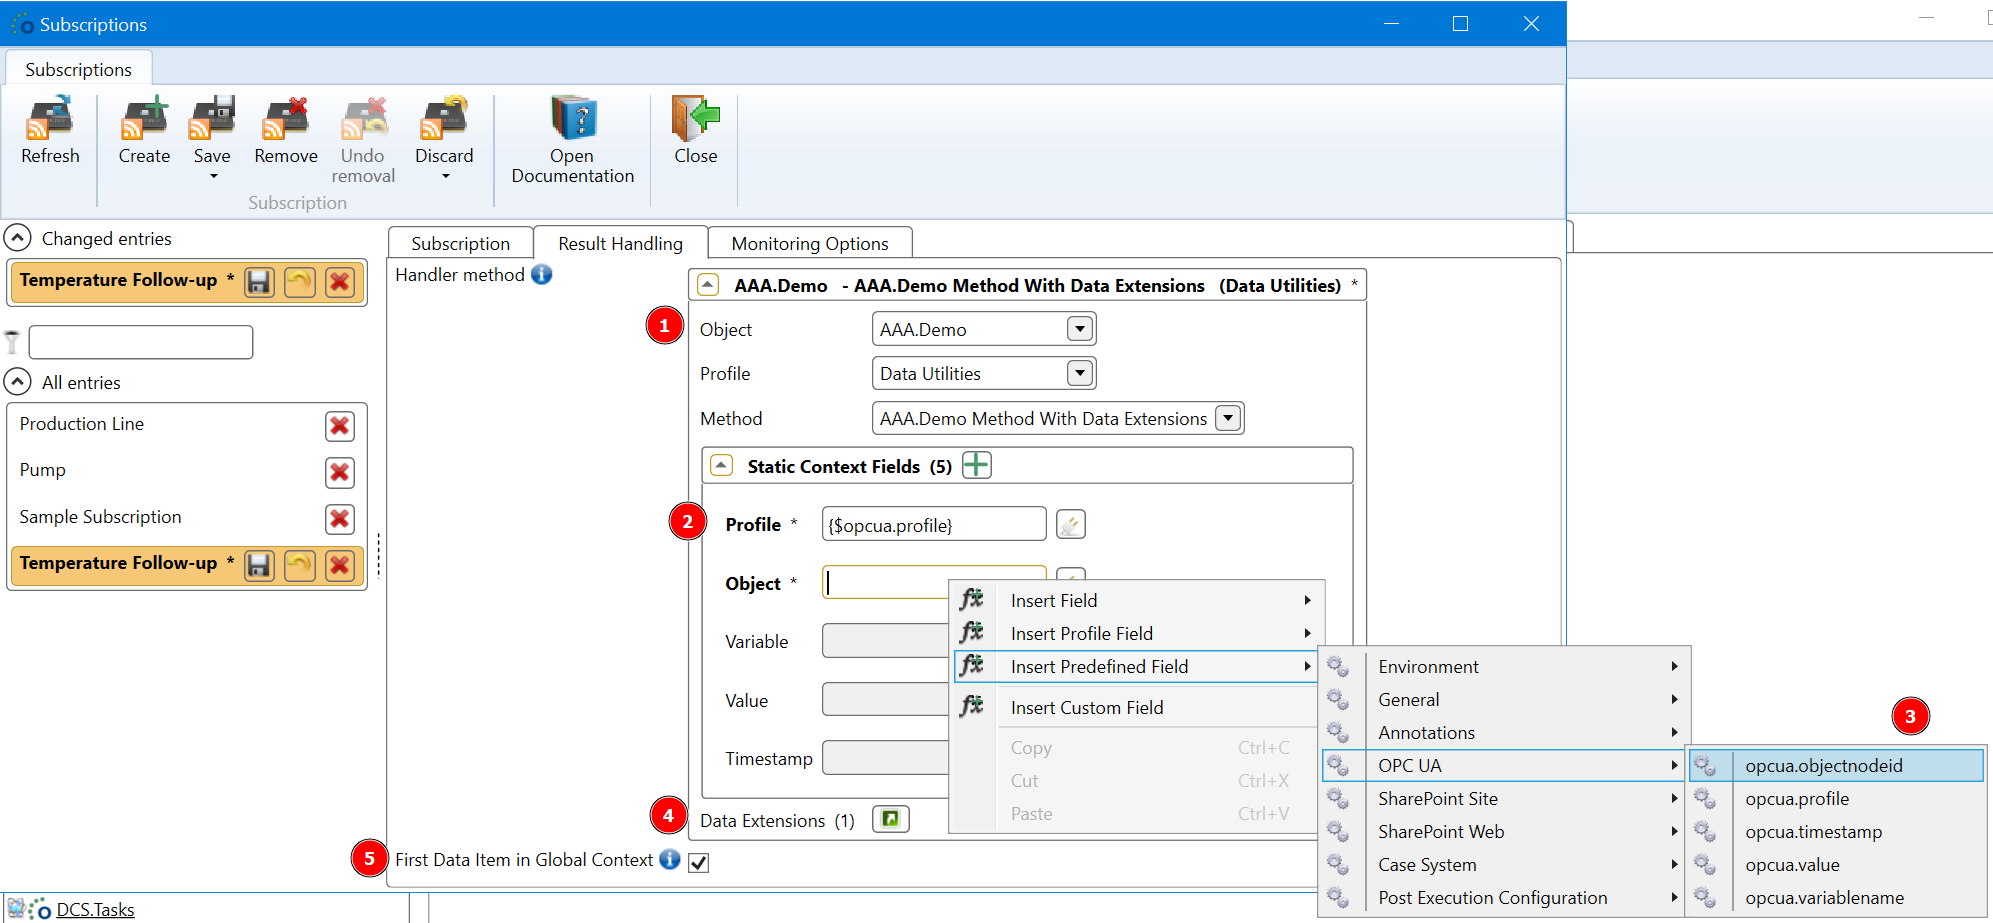
- Handler method: The method to execute when a data change is received.
- Context Fields: List of all input context fields that will be set when the method is called by the OPC UA service. By breaking inheritance it will be possible to add in the specific OPC UA context tokens to set the incoming data values to the proper context fields. The context tokens can be found in the Ometa Business Connector GUI context menu, and selecting Insert Predefined Field and then OPC UA.
- Field: These are the input fields for the method.
- Data Extensions: Allows for configuration for the profiles of data extensions if the configured method has any.
- First Data Item in Global Context: By default, all incoming data items are passed in a method as separate context records. When selecting this, the first incoming item of a set of items will be added to the method global context and all others as separate context records. In case the Queue size is set to one, every incoming data item will be inserted in the method global context.
Available OPC UA context token fields:
| Context token | Description |
|---|---|
| opcua.profile | The name of the OPC UA profile the device uses. This was configured when enabling monitoring. |
| opcua.objectnodeid | The unique identifier within OPC UA for the device. |
| opcua.variablename | The name of the variable being monitored. This is useful to distinguish between different variables being monitored on a single object. |
| opcua.value | The new value that exceeded the deadband and triggered a data change. |
| opcua.timestamp | The timestamp of the measurement on the OPC UA server. |
Tip
If no context from OPC UA is needed, no configuration besides the handler method is necessary.
Warning
Using subscriptions with result handling towards a method call requires the Ometa Generic REST service to remain available.
Result Handling for a Lifecycle
This tab contains the configuration for the direct write to case for high performance logging of values.
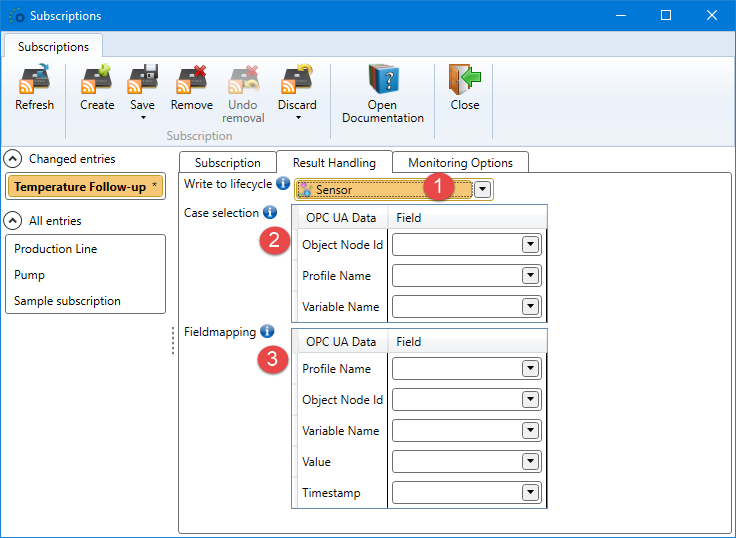
- Write to lifecycle: The lifecycle to update when a new message is received.
- Case selection: Declares the mapping to identify which case must be updated. It is recommended to have a case property for profile name, object node id and
variable name which correspond to these fields. Declaring a vague mapping could lead to the wrong case selection and may result in inconsistent case data.
- Profile Name: The name of the OPC UA profile the device uses. This was configured when enabling monitoring.
- Object Node ID: The unique identifier within OPC UA for the device.
- Variable Name: The name of the variable being monitored. This is useful to distinguish between different variables being monitored on a single object.
- OPC UA Data: Relates to the data within OPC UA, besides Profile Name, Object Node ID and Variable Name, the following extra fields are always available:
- Value: The new value that exceeded the deadband and triggered a data change.
- Timestamp: The timestamp of the measurement on the OPC UA server.
Note
The Variable Name is not mandatory to map for the case selection if only one variable per sensor is being monitored. However if multiple variables are being monitored, mapping the variable name is required or the data of all variables will be sent to a single case leading to confusion and data inaccuracies.
Monitoring Options
The monitoring options allows customization for the following fields:
- Publishing interval: Reporting interval in milliseconds from the OPC UA server to the Ometa OPC UA Service for the subscription. 500 by default.
- Sampling interval: Default interval time in milliseconds between sensor samplings by the OPC UA server during monitoring. 250 by default.
- Queue size: Default queue size of how many sampled values are kept per monitored item between publish actions by the subscription. 1 by default.
Queue Size
The queue size concept can be a bit confusion, especially combined with the total number of items being reported to the framework OPC UA service. Thus, some additional clarification is given in this paragraph.
It is important to realize that every monitored item has its own queue with a specific length or size. And there can be multiple monitored items per subscription. The subscription only acts as a kind of transportation channel, it does not have any internal queueing whatsoever.
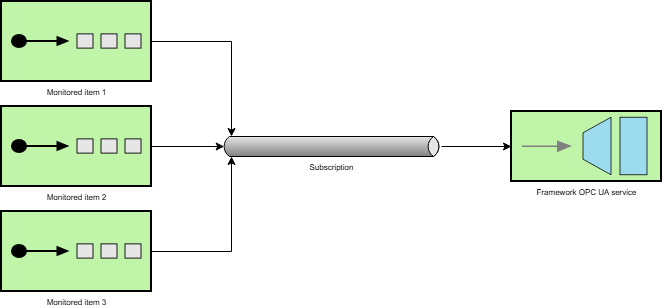
For example, the image above shows a subscription with 3 monitored items and each items has a queue size of 3. At every publish action, the subscription takes the values in those queues of each items and sends them to the OPC UA service, after which the queue of each item is emptied. If we assume that all queues are full for those 3 monitored items, it means that the OPC UA service will receive 9 values from the subscription.
Additionally, a monitored item queue follows a default setting in case of overflow, e.g. an attempt is made to add an extra value to an already full queue. In those case, the oldest item (usually the first item) in the queue will be discarded and the new value is added. This is done to make sure always the latest and most up-to-date information will be sent to the recipient, the OPC UA service in our case.
Note
The reason for defining the queue size on a subscription in the dialog is mainly done for simplicity of configuration. This way, a user simply sets the queue size and it will be applied to every monitored item that is instantiated over that subscription without any need to do something extra.