Framework Performance Benchmarks
The article below shows the performance of the framework in various scenarios, and possible changes that can be made to improve the performance.
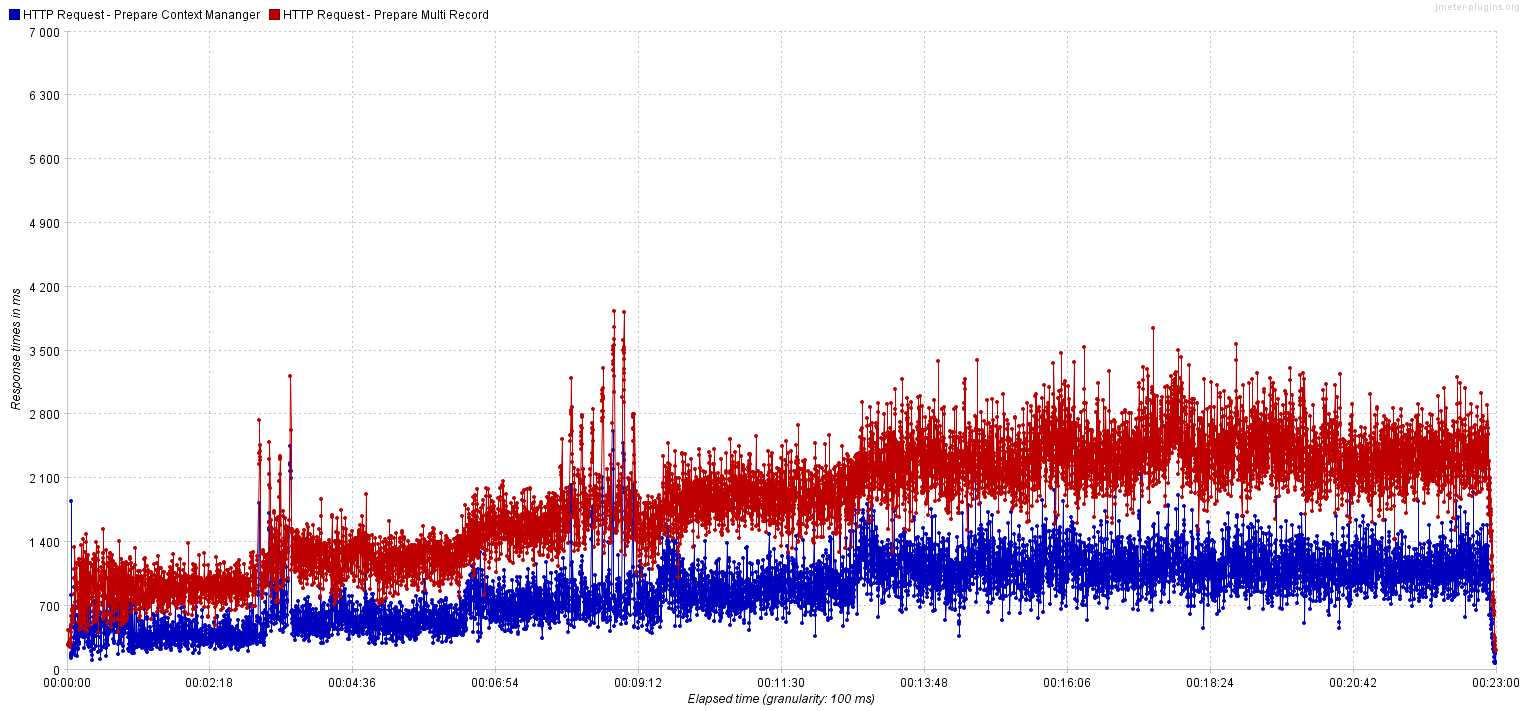
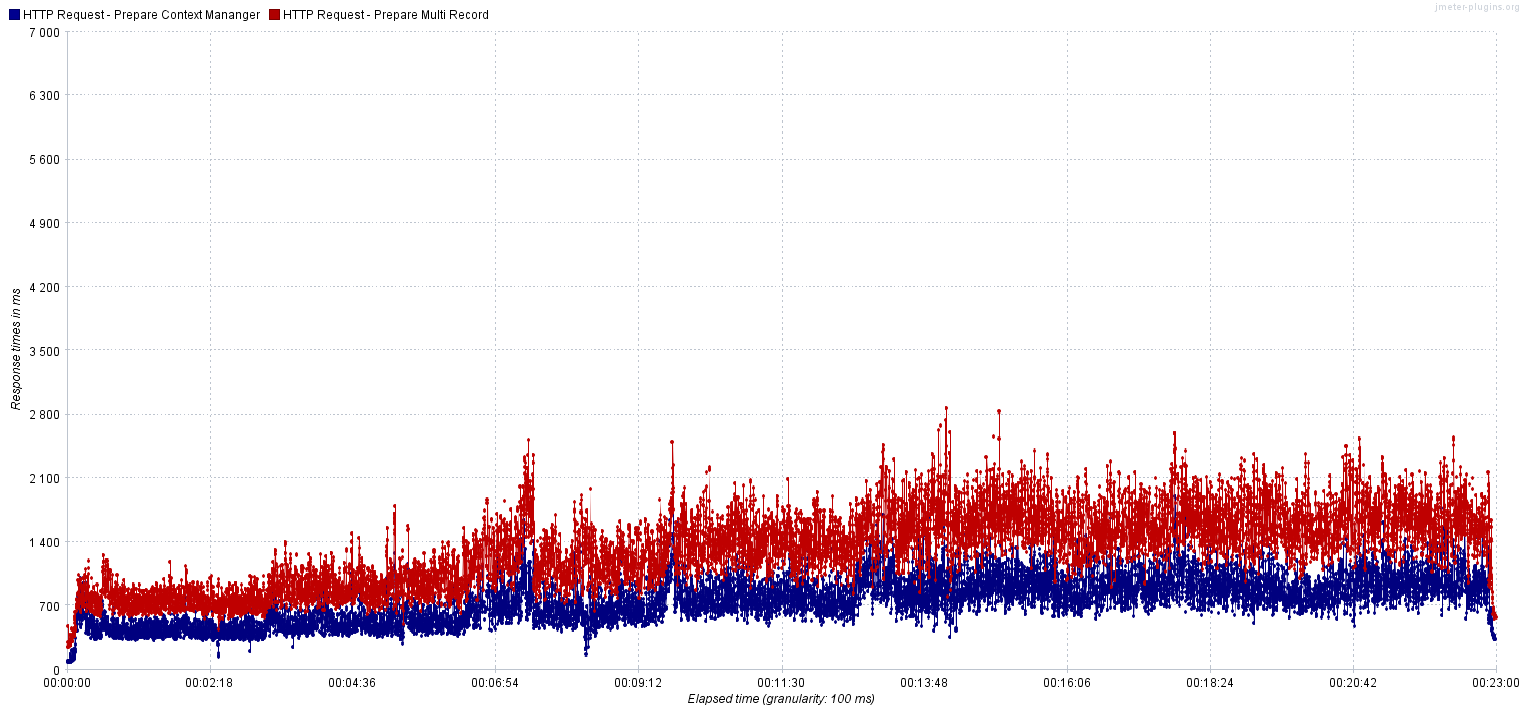
Response time analysis
Scenario
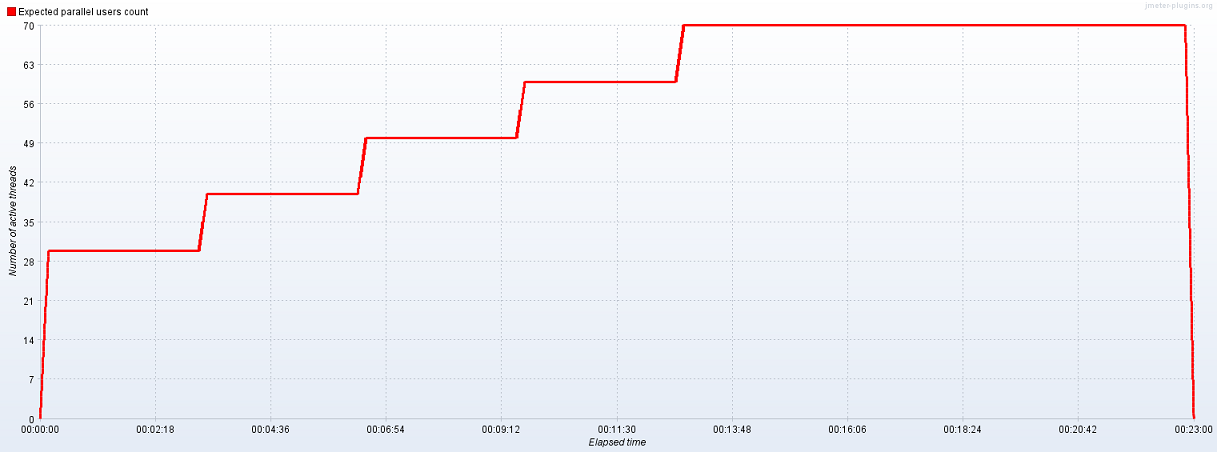
A load on the framework server is simulated with users that refresh a page continuously. This page contains a context manager and a multi record view. The number of concurrent users is gradually increased. The multi record view displays the first 25 rows out of 3000 records returned from the query.
To focus on only the Ometa framework performance, the multi record method output is cached. This is done to prevent the underlying SQL query of the method being the bottleneck of the system.
This plan represents approximately 40 requests per second, depending on the response time. This goes up to 52 requests per second (or ~4.500.000 per day) with the optimal configuration shown in Run 3 .
The benchmarks below are on Ometa Framework v5.0.0 on Windows Server 2019, where the server serves as the Ometa Framework Server and Web API Server (IIS).
- 16 cores @2.19Ghz
- 24 GB RAM
- HDD Storage

The graph shows inconsistent response times with peaks up to a few seconds. These peaks correspondend with the disk usage indicating that the bottleneck in this run was the disk.