Categorical Charts Configuration
Categorical charts are typically used for comparing different sets of data - for example the revenue throughout the last 4 years.
A categorical chart consists of a category axis and a value axis. As the name suggests, the value axis is used to see the actual value for a category in a serie. The category axis is used to provide a meaningful name to the value in the serie.
Settings
The settings tab is used to set the type of chart and what data to use.
The categorical charts follow the basic settings.
Design
Behind the scenes, the Ometa framework will convert the returned records into separate sets that will be consumed by the chart. You can tell the framework how it should construct the separate sets by configuring certain fields. The available fields come from the method output fields.
Categorical charts extend the basic design.
Series
A serie is a set of value points that can be compared to each other. Each serie should contain a value for every category value provided by the X-Axis field. For the record set above we want to leave the series empty.
It is also possible to configure a custom color scheme for the categorical charts.
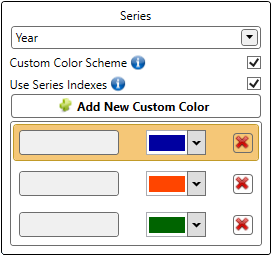
Note that you can link the custom colors to a specific series by unchecking 'Use Series Indexes' and by filling in the series name in the designated text boxes. If you decide to not use the indexes, it is required that you link every custom color to a specific series.
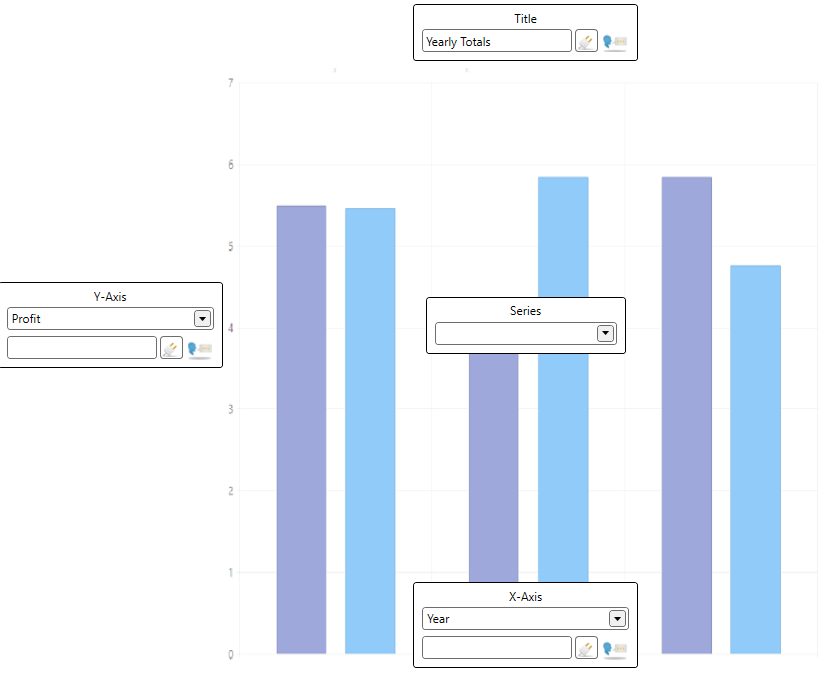
X-Axis
The X-Axis will contain the distinct values for the configured X-Axis field. It's possible to define a label that will be shown beneath the X-axis.
Y-Axis
The Y-axis will indicate the value for a category in a serie. This field should be of type Integer, Number or Currency. It's possible to define a label that will be shown next to the Y-axis
Binding Parameters
It is possible to bind to two (X and Y) or three (X, Y and series).
Two Binding Parameters
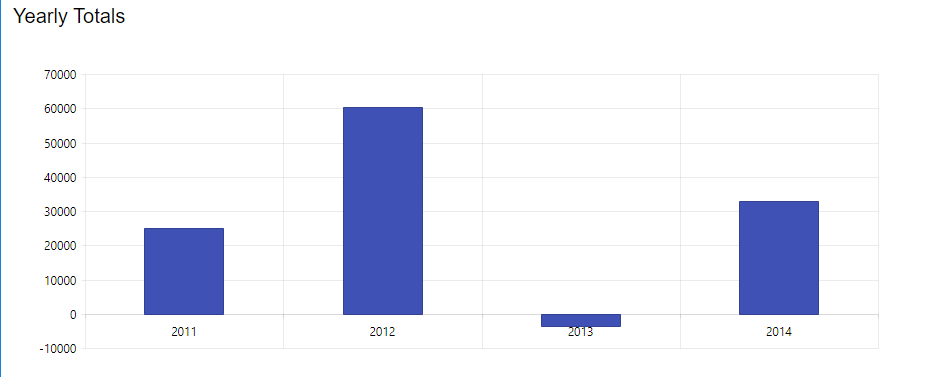
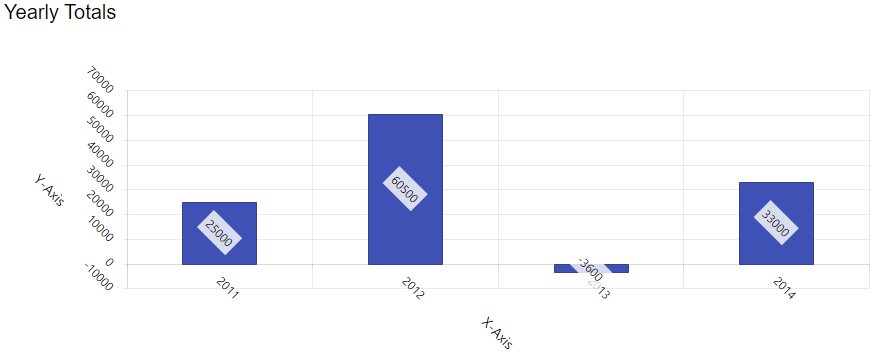
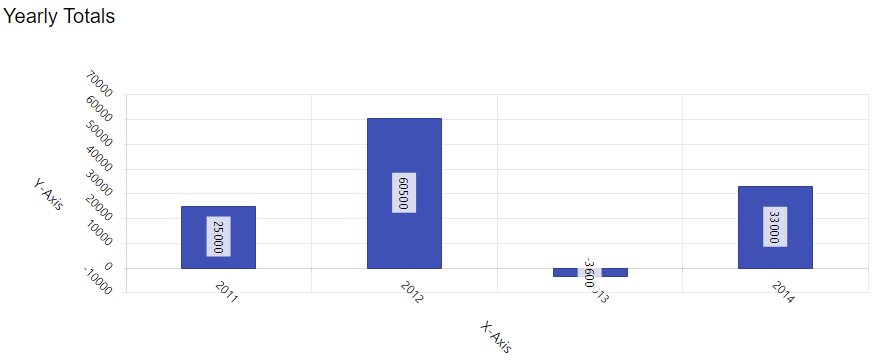
When only binding on X and Y, the chart will display one value per category. For example showing the total profit of each year from 2011 to 2014.
The result method looks as followed:
| Record | Year | Profit |
|---|---|---|
| 1 | 2011 | 25000 |
| 2 | 2012 | 60500 |
| 3 | 2013 | -3600 |
| 4 | 2014 | 33000 |
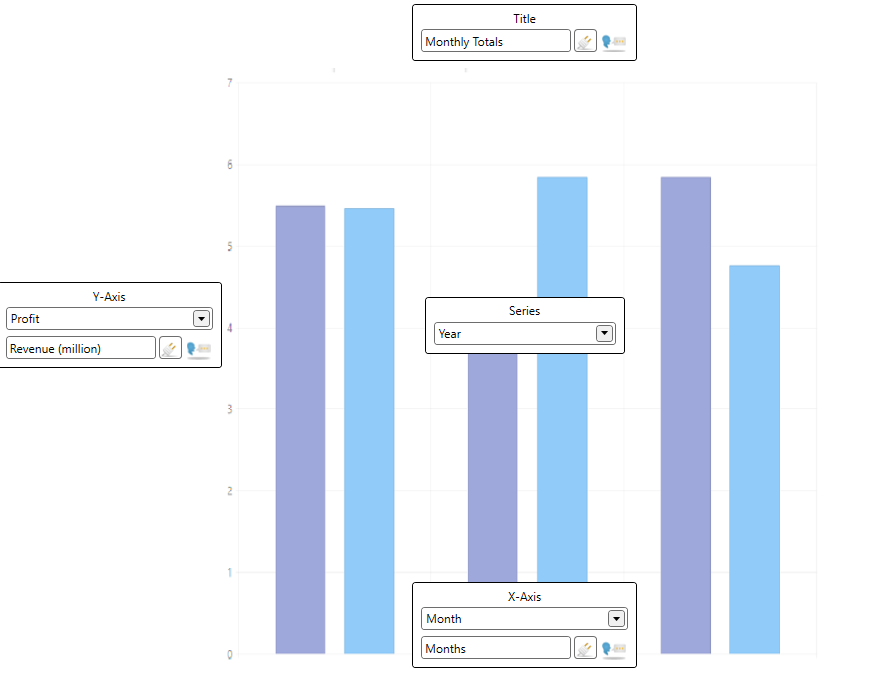
Three Binding Parameters
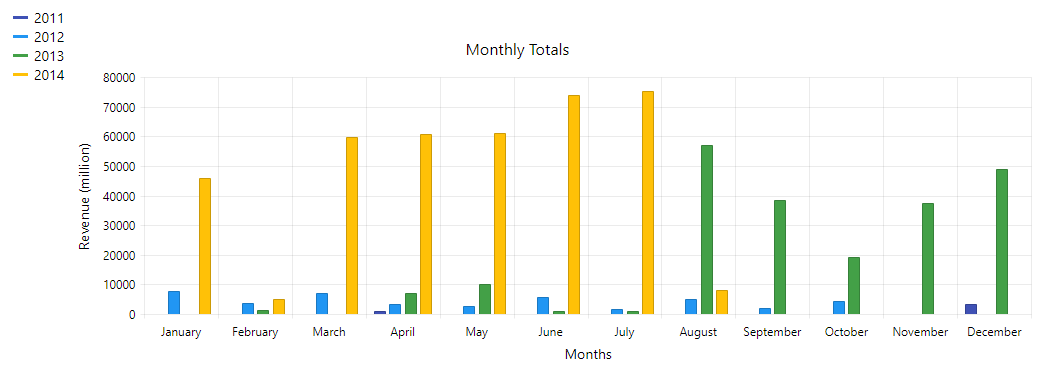
When binding on X, Y and defining a serie, the chart will display multiple Y values for one X value. For example showing the revenue of the same month for different years.
Each serie should be a separate record, with a serie value, a category value and the value for the line. The following table displays the results of a method returning the revenue for each month from 2011 to 2014.
| Record | Year | Month | TotalDue |
|---|---|---|---|
| 1 | 2011 | January | 0 |
| 2 | 2011 | February | 0 |
| 3 | 2011 | March | 0 |
| 4 | 2011 | April | 1148.0488 |
| 5 | 2011 | May | 0 |
| ... | ... | ... | ... |
| 11 | 2011 | November | 0 |
| 12 | 2011 | December | 3306.6018 |
| 13 | 2012 | January | 7739.9493 |
| 14 | 2012 | February | 3630.7256 |
| 15 | 2012 | March | 7149.0830 |
| ... | ... | ... | ... |
| 44 | 2014 | August | 8211.8258 |
| 45 | 2014 | September | 0.0011 |
| 46 | 2014 | October | 0 |
| 47 | 2014 | November | 0 |
| 48 | 2014 | December | 0 |
Layout
It is possible to style the charts based on your needs. Categorical charts have extra layout options on top of the basic chart layout options.
Label Rotation
It is possible to rotate the value, X-axis and Y-axis labels. The number provided is the degree of the rotation.
Stacked
When using a bar, line or area chart, the option to stack series is displayed. When set to True, the items from the different series with the same X value are stacked on top of each other.
100% stacked
When the Stacked option is set to True, the option to stack 100% is displayed. When setting the 100% option to True, the chart takes all values of the series with the same X value and calculate the percentage of each value.
| Property | Value |
|---|---|
| Value Label Rotation | 90 |
| X-axis Label Rotation | 45 |
| Y-axis Label Rotation | 45 |
Direction
When using a bar chart, the option to choose the direction is displayed. The bars will be rendered horizontal or vertical based on the selected direction.