Layout
It is possible to style the charts based on your needs. In the following paragraphs we explain the different styling options in detail.
The different chart catagories extend these layout options with their own layout options. Refer to the categorical design or circular design.
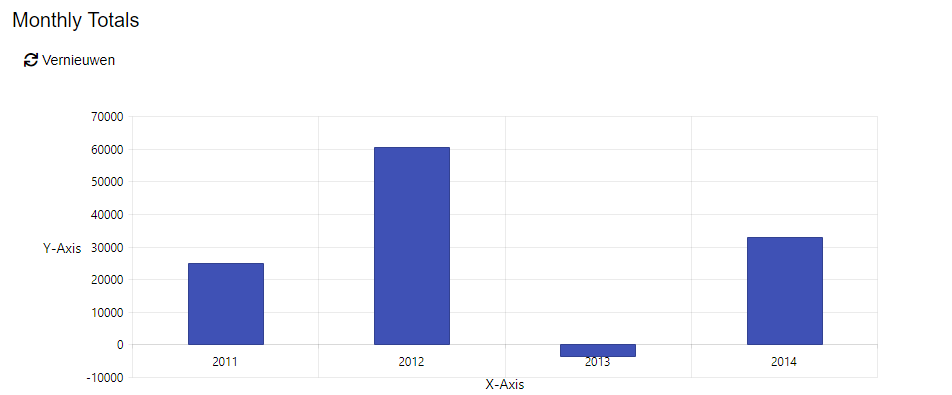
Size and Background
| Property | Description |
|---|---|
| Width | Forces the chart into a certain width. If this value is set to 0, the chart will size automatically depending on the available width of its container. |
| Height | Forces the chart into a certain height. If this value is set to 0, the chart will size automatically depending on the available height of its container. |
| Background | Gives a certain background color to the entire chart. When not provided, the background is transparent. |
Example
| Property | Value |
|---|---|
| Width | 400 |
| Height | 250 |
| Background | Silver |
Refresh
When checked, a refresh button will be displayed that fetches new values and applies them to the chart.
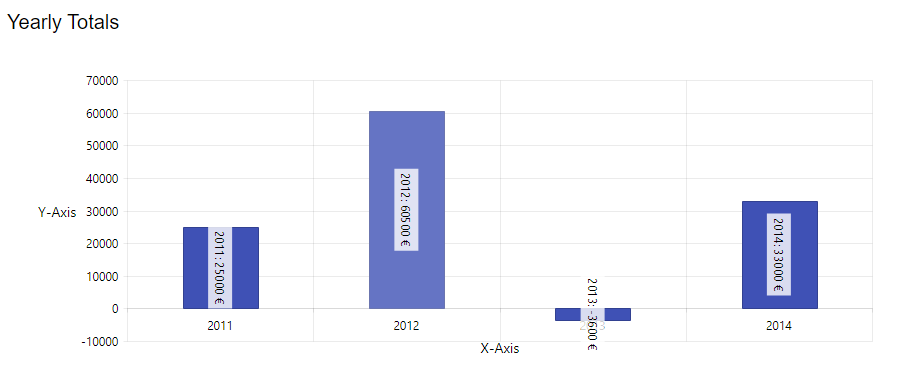
Value Label
When checked, a label on each item will be shown.
Value Label Rotation
When Value Label is checked the option to rotate the label is displayed. This option will determine the angle of the Value Label.
Value Label Format
Parses the Value Label to a specific format. There are variables provided to aid formatting the label. The variables differ between categorical and circular charts. When no format is given, the value of the item will be taken.
| Property | Description |
|---|---|
| X-Axis field - {$xAxisField} | The value for the current X-Axis field. |
| Y-Axis field - {$yAxisField} | The value for the current Y-Axis field. |
| Percentage Series field - {$percentageSeriesField} | The percentage of the current item in the series. |
| Series field - {$seriesField} | The value of the current series. |
Example
| Property | Value |
|---|---|
| Show Value Label | True |
| Value Label Rotation | 90 |
| Value Label Format | {$xAxisField}: {$yAxisField} € |
Border
The border is applied on the entire visible area of the chart.
| Property | Description |
|---|---|
| Color | Defines the color of the border. |
| Border Type | Defines the type of the border. This is either a solid line, a dashed line or a dotted line. |
| Border Width | Defines the width of the border in pixels. |
Example
| Property | Value |
|---|---|
| Color | Black |
| Border Type | Solid |
| Border Width | 1 |
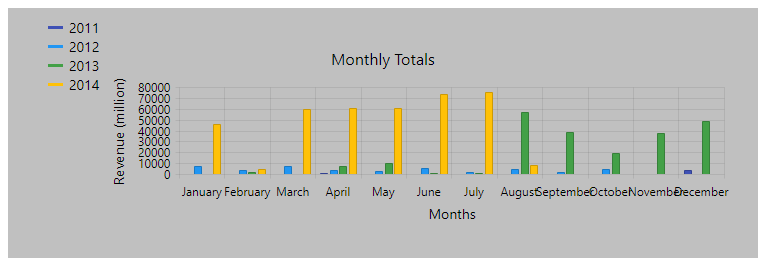
Legend
| Property | Description |
|---|---|
| Orientation | Defines the direction in which the legend items should be rendered. This is either below each other (Vertical) or next to each other (Horizontal). |
| Position | Defines the position of the legend compared to the chart data area itself. A legend can be positioned to the left, to the right, on top or below the chart data area. |
| Align | Defines how the legend should be aligned. The legend can be aligned to the start, center or end. |
| Background Color | Defines the background color of the legend area. |
Example
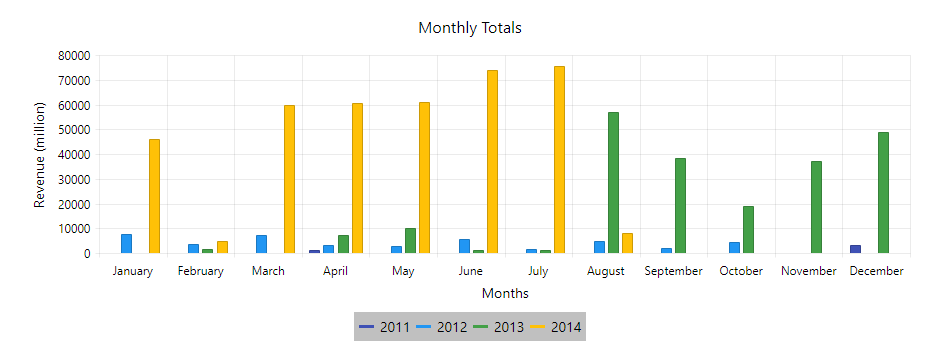
| Property | Value |
|---|---|
| Orientation | Horizontal |
| Position | Bottom |
| Align | Center |
| Background Color | Silver |
Tooltip
A tooltip shows a pop-up when hovering over an item. The pop-up contains information about the hovered item.
All Series In Tooltip
Whether all series are shown in the tooltip when hovering over the X-Axis pane.
Format
Parses the tooltip to a specific format. There are variables provided to aid formatting the label. The variables differ between categorical and circular charts. When no format is given, the value of the item will be taken.
When All Series In Tooltip is set to true, the format will be used for the value of every series.
| Property | Context Token | Description |
|---|---|---|
| X-Axis field | {$xAxisField} | The value for the current X-Axis field. |
| Y-Axis field | {$yAxisField} | The value for the current Y-Axis field. |
| Percentage Series field | {$percentageSeriesField} | The percentage of the current item in the series. |
| Series field | {$seriesField} | The value of the current series. |
Example
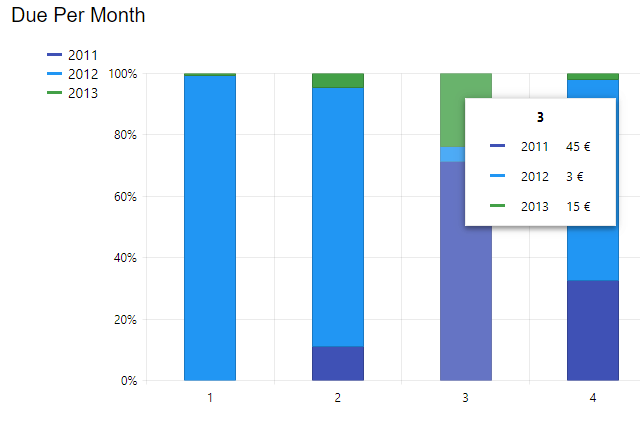
| Property | Value |
|---|---|
| All Series In Tooltip | True |
| Format | {$yAxisField} € |
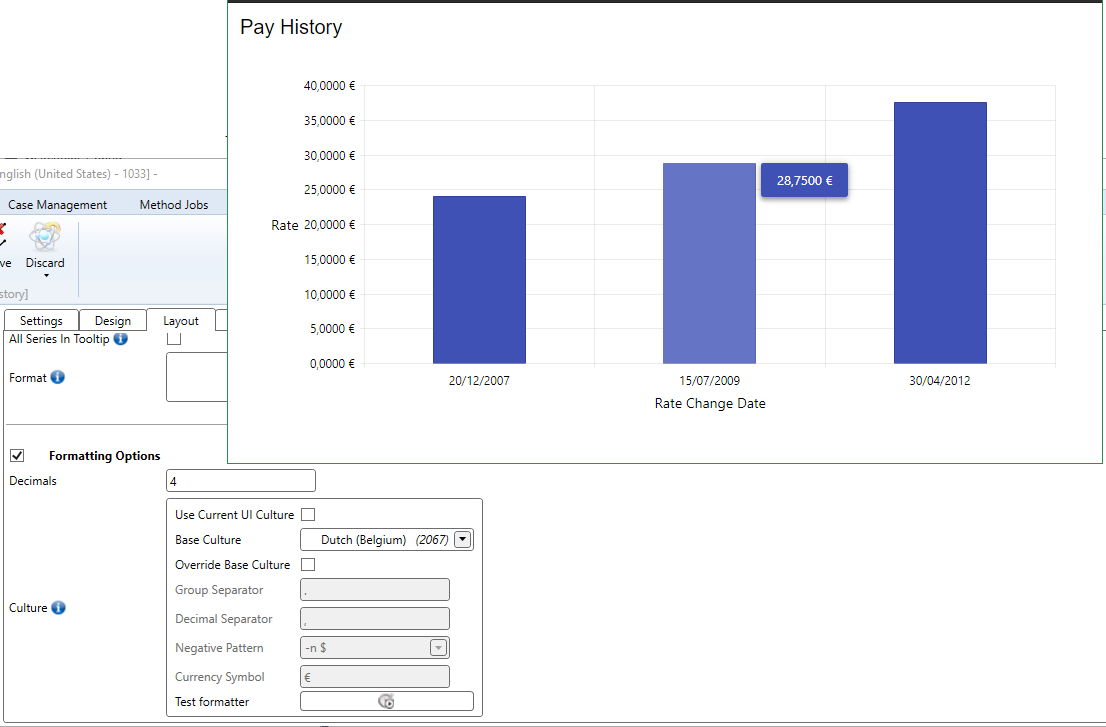
Formatting Options (Categorical Charts Only)
| Property | Description |
|---|---|
| Decimals | Defines how many decimals that need to be shown for a value in the chart. |
| Culture | Defines which culture settings need to be applied on the values in the chart. |
The following screenshot shows how this configuration would reflect itself: