Circular Charts Configuration
Circular charts give a proportional overview of a value in a set of data.
Settings
The settings tab is used to set the type of chart and what data to use.
The circular charts follow the basic settings.
Design
Behind the scenes, the Ometa framework will convert the returned records into separate sets that will be consumed by the chart. You can tell the framework how it should construct the separate sets by configuring certain fields. The available fields come from the method output fields.
Circular charts extend the basic design.
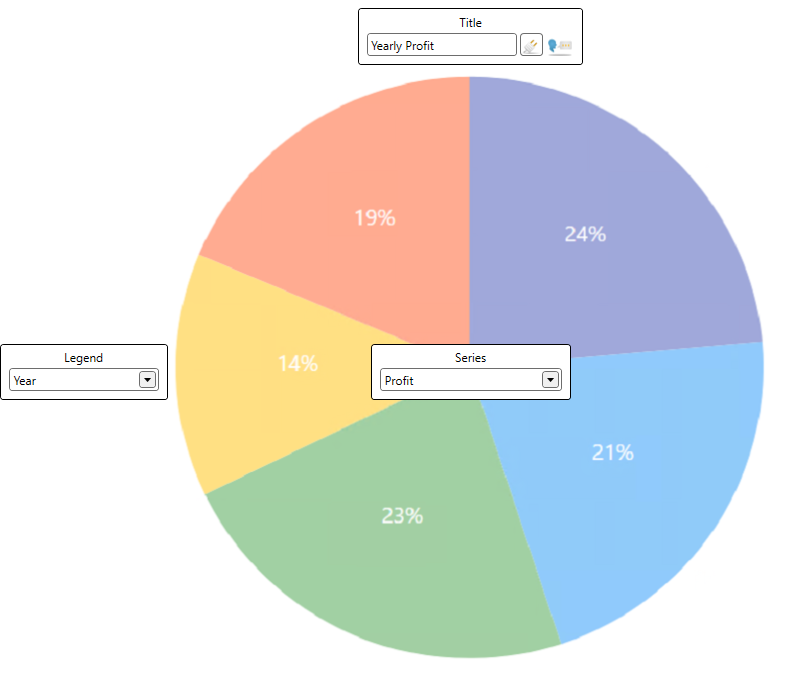
Series
For the Series field, we specify the field that will contain all the data of the circular chart.
For example: A chart that shows the profit of each year. The profit each year is the series.
Legend
For the Legend field, we specify the field that holds the distinct values of the data set.
For example: A chart that shows the profit each year. The year is the legend.
Binding Parameters
Circular charts take two bindings as configuration, legend and series.
Tip
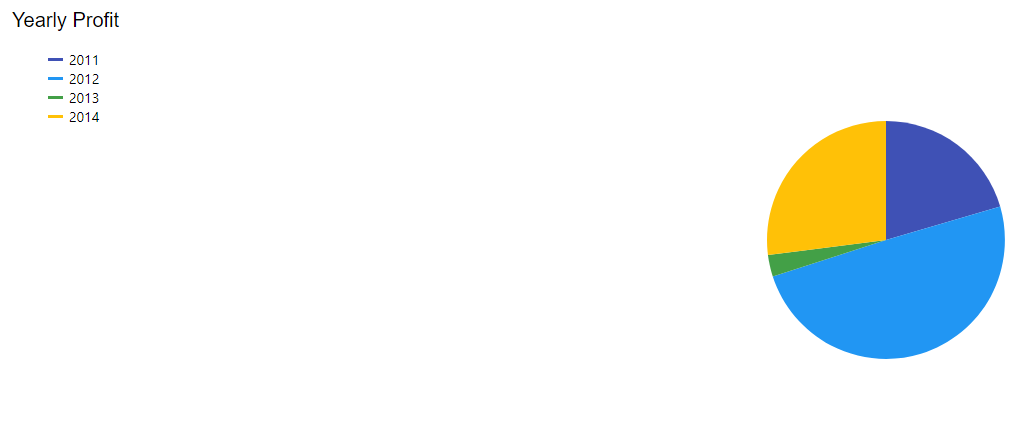
Negative values will be shown as absolute values. -3600 will be handled as 3600.
The result method looks as followed:
| Record | Year | Profit |
|---|---|---|
| 1 | 2011 | 25000 |
| 2 | 2012 | 60500 |
| 3 | 2013 | -3600 |
| 4 | 2014 | 33000 |
Layout
It is possible to style the charts based on your needs. Circular charts have extra layout options on top of the basic chart layout options.
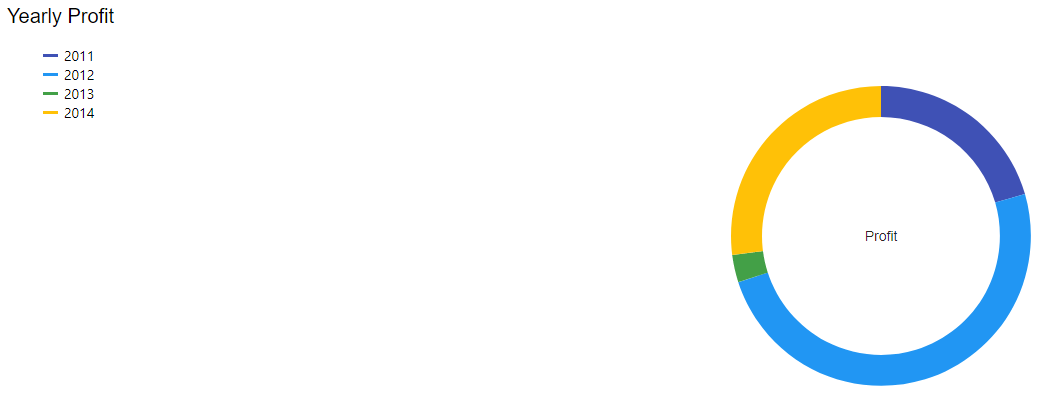
Center Hole
When using a donut chart, the options to style the center hole are displayed. It is possible to configure the width and the text in the hole.
Width
Configuring a width for the center hole will size the center hole. When setting the width to 0, the chart will automatically calculate the width of the hole.
Text
Configuring text for the center hole will put the provided text in the center hole.
Warning
The provided input fields in the wpfGui are not yet mapped. Only plain text can be shown at this moment.
Example
| Width | Text |
|---|---|
| 150 | Profit |